
3.2. Colorimetry#
Spectrophotometric Colorimetry describes the interaction of light with a sample across the entire visible spectrum (typically 400 nm to 700 nm) to get a numerical representation of its color. Colorimetry is available for all spectrometers operating in the visible range and can be accessed using to show the Colorimetry window (Figure 3.6).
See also
See the application example Colorimetry of Light Sources & Color Charts to see see colorimetry in action.
Colorimetric analysis performs the following steps:
raw spectral data (a spectral reflectance curve for opaque solids or a spectral transmittance curve for transparent liquids/solids) is converted into colorimetric values that correspond to how the human eye perceives color under specific lighting conditions
the spectral curve data is mathematically integrated with standard Observer functions (e.g., the CIE 1931 Standard Observer) and standard Illuminant data (e.g., D65 for daylight) to calculate the \(X\), \(Y\), and \(Z\) tristimulus values. These values represent the perceived amount of Red, Green, and Blue light, respectively. The Tristimulus Values (\(X, Y, Z\)) are calculated by integrating the product of these three functions over the visible spectrum:
\[ X = k \sum_{\lambda} R(\lambda) S(\lambda) \overline{x}(\lambda) \Delta\lambda \]\[Y = k \sum_{\lambda} R(\lambda) S(\lambda) \overline{y}(\lambda) \Delta\lambda\]\[Z = k \sum_{\lambda} R(\lambda) S(\lambda) \overline{z}(\lambda) \Delta\lambda\]Where:
\(R(\lambda)\) is the measured spectral curve (from the spectrophotometer).
\(S(\lambda)\) is the SPD of the chosen illuminant.
\(\overline{x}, \overline{y}, \overline{z}\) are the CIE color matching functions.
\(k\) is a normalizing constant.
The \(Y\) value is particularly important, as it represents the sample’s absolute luminance or lightness.
The \(X, Y, Z\) values are converted into the two chromaticity coordinates (\(x\) and \(y\)) using ratios:
\[x = \frac{X}{X + Y + Z}\]\[y = \frac{Y}{X + Y + Z}\]and plotted in a chromaticity diagram (e.g. the CIE 1931 \(xy\) Chromaticity Diagram), a 2D projection that shows only the hue and saturation of a color, independent of its lightness (luminance) (Figure 3.6 right panel).
The \(X, Y, Z\) values are transformed into coordinates in a uniform color space like the CIE \(L^*a^*b^*\) (Lab) space.
\(L^*\): Lightness (0=black, 100=white).
\(a^*\): Red/Green axis (+a=red, -a=green).
\(b^*\): Yellow/Blue axis (+b=yellow, -b=blue).
The CIE \(X, Y, Z\) Tristimulus Values are converted to RGB (Red, Green, Blue) for display on a screen using the D65 white point.
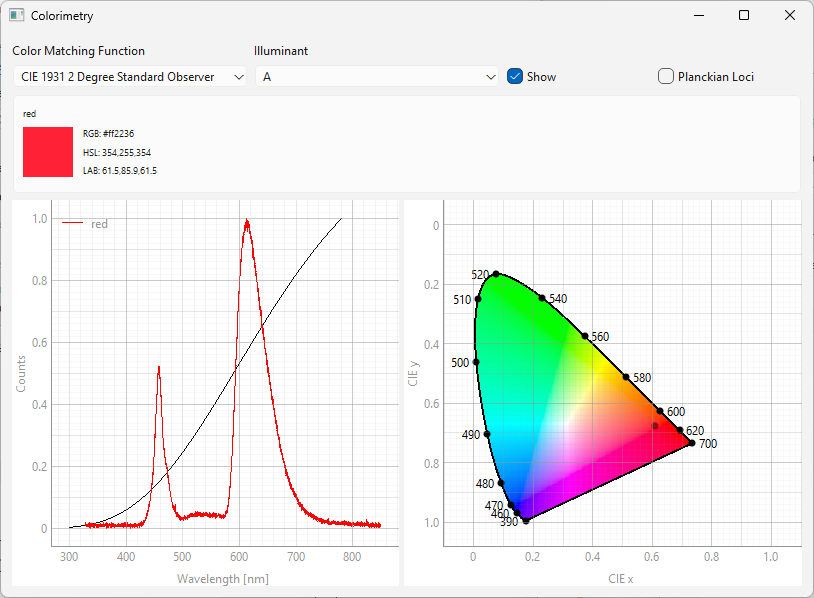
Fig. 3.6 The Colorimetry window#
The Colorimetry window is split into four sections (from top to bottom):
The top bar allows configuration of the illuminant and color matching function used in the analysis
the color result view, which contains:
a visual representation of the calculated color
color values in the RGB, HSL, and CIE \(L^*a^*b^*\) color space
Hint
Color values can be copied using drag & drop.
The spectrum view, which shows the selected spectrum and (optionally) the selected illuminant
the chromaticity diagram. The location of the selected spectrum in \(x\)\(y\) chromaticity coordinates will be indicated by a circle. The outline of the circle corresponds to the color of the selected spectrum.
Hint
Colorimetry works both in real time (live analysis while recording spectra) or post acquisition. To analyse saved spectra:
display the Colorimetry window
select the spectrum or spectra in the spectrum side bar
Multiple spectra can be analyzed simultaneously (see Figure 4.6 for an example).
The Colorimetry window (Figure 3.6) gives access to the following settings:
- Color Matching Function
Selects a standard observer function
- Illuminant
Selects the illuminant, the light source that was used to record the spectrum. Illuminants include:
standard incandescent illuminants with different color temperatures (A-D)
fluorescent lamps
LED illuminants
See also
See Figure 4.5 for an example of a LED illuminant.
- Show
Toggles the display of the selected illuminant spectrum in the spectrum plot (black trace in the left panel of Figure 3.6)
- Planckian Loci
Toggles the display of Planckian Loci (or Black Body Loci), a curved reference line in the chromaticity diagram. This line represents the color of an ideal black-body radiator as its temperature is increased from absolute zero up to infinity.
See also
See Section 3.3 on Radiometry for more information, i.e. on the Correlated Color Temperature (CCT).