4.1. The Solar Spectrum#
Spectral calibration is also relevant when multiple spectrometers with overlapping or adjacent spectral ranges are used to record the spectrum of the same light source (see scheme in Figure 4.1). Figure 4.3 displays the spectrum of the sun using two spectrometers that cover the visible and near-infrared range of the solar spectrum.
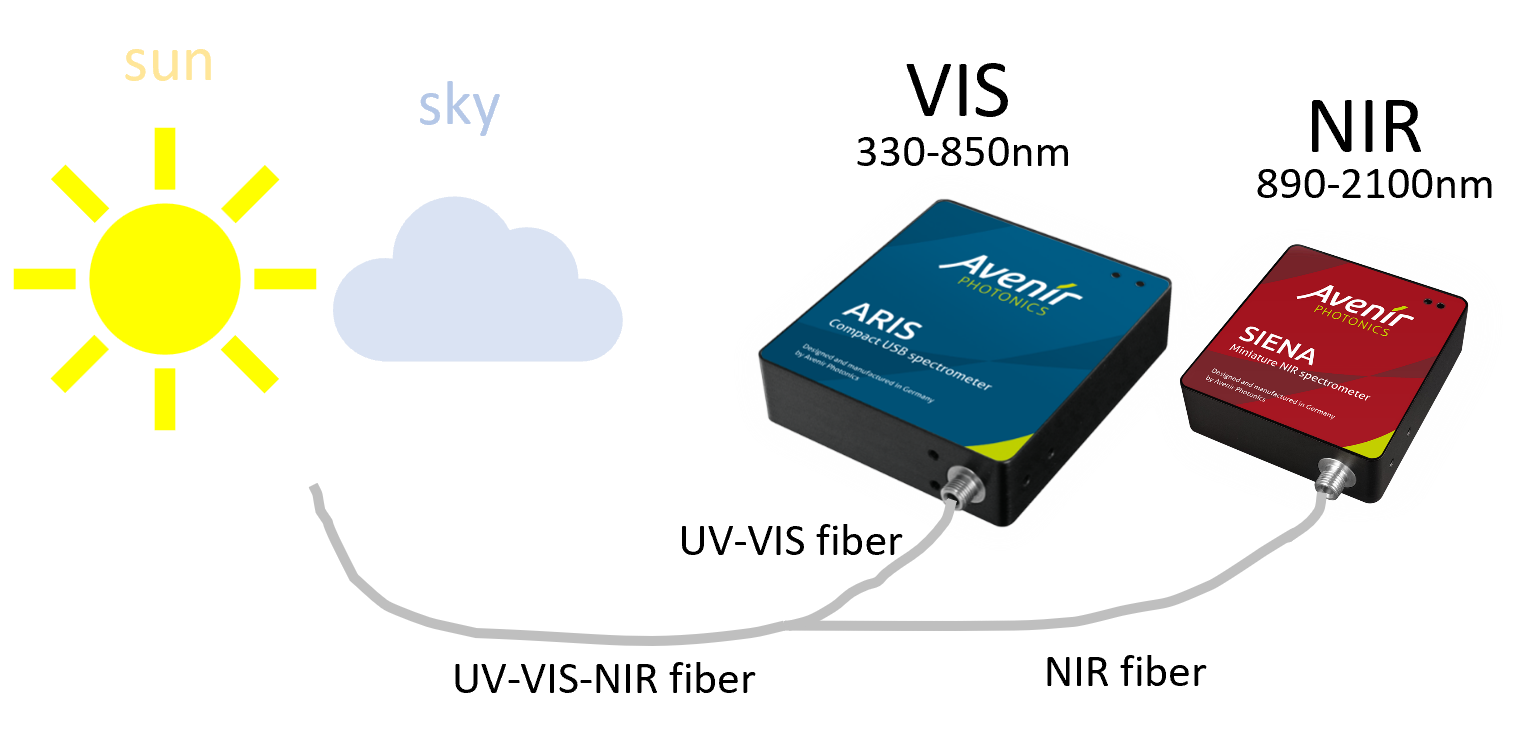
Fig. 4.1 Measuring the spectrum of the sun using two spectrometers#
Both spectrometers (and their input fibers) were calibrated using the same reference light source according to the procedure outlined in Section 2.1.6 (Intensity Calibration).
The spectrum of a reference light source (incandescent lamp with a color temperature of 2600 K) was acquired using both spectrometers (Figure 4.2 left). The decrease in sensitivity at NIR wavelengths of the VIS spectrometer (700-800 nm) is clearly visible. It is obvious that the spectrum doesn’t match the expected shape of a tungsten lamp at all.
The reference intensity curve was calculated using the known color temperature of the reference light source in the spectral range between 200-3000 nm using Planck’s Law (4.1).
(4.1)#\[ I = \frac{2hc^2}{\lambda^5} \frac{1}{\exp(\frac{h c}{\lambda k_B T}) -1 } \]Here, \(\rm{h}\) is Planck’s constant, \(\rm{c}\) is the speed of light, \(\rm{k_B}\) is Boltzmann’s constant, \(\rm{T}\) is the absolute temperature of the black body emitter, and \(\rm{\lambda}\) is the wavelength.
The calibration data was applied to the two spectrometers. This results in a intensity-corrected spectrum of the reference light source (Figure 4.2 right).
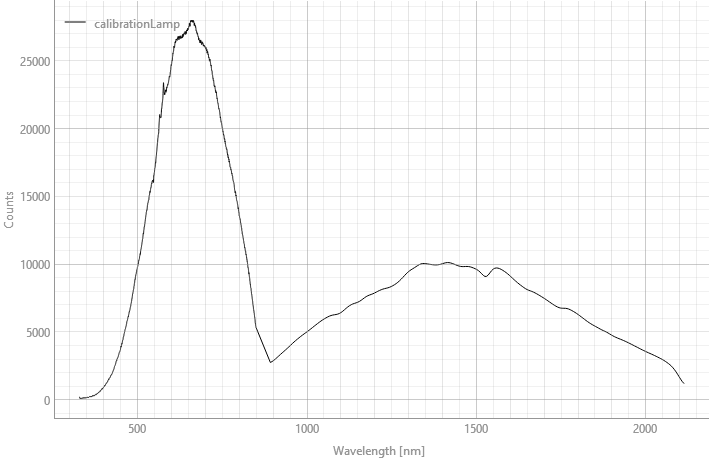
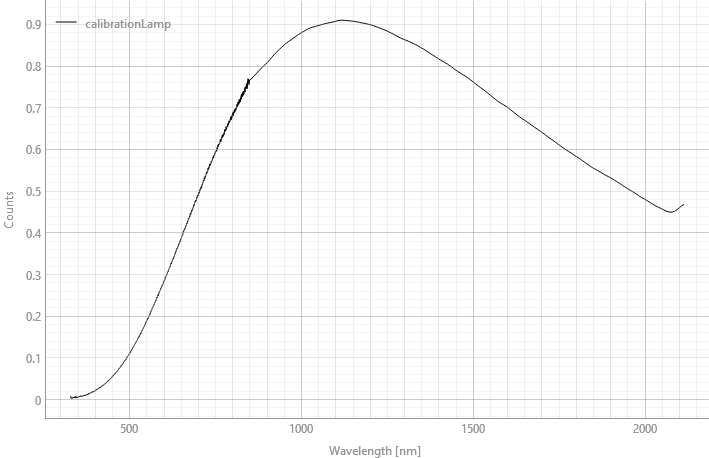
Fig. 4.2 Calibrating two spectrometers#
After intensity calibration of both spectrometers, the recorded spectrum of the sun (Figure 4.1) matches that of a black body emitter with a color temperature > 5000 K (deviations are due to atmospheric scattering, which increase when the input fiber is pointed away from the sun). Fraunhofer lines are visible in the spectrum. Fraunhofer lines are a set of dark spectral absorption lines observed in the continuous spectrum of the Sun and other stars that reveal the chemical composition of stellar atmospheres. Note that some dark lines, like the A and B bands, are Telluric lines, meaning they are caused by absorption by molecules (primarily oxygen (\(\text{O}_2\)) and water vapor (\(\text{H}_2\text{O}\))) in the Earth’s own atmosphere, rather than the Sun’s.
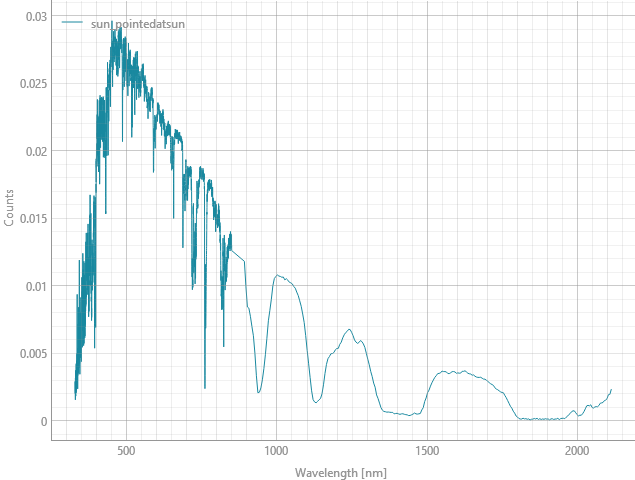
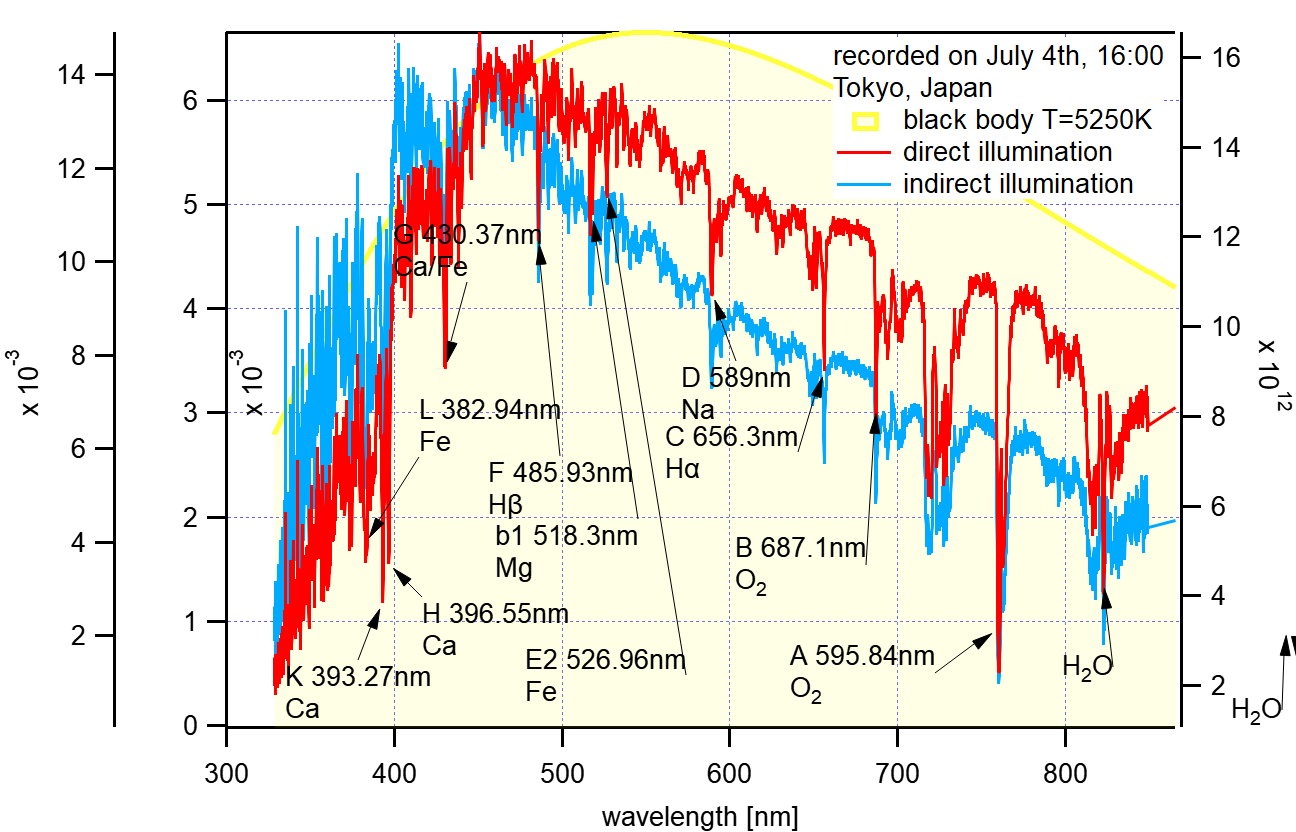
Fig. 4.3 The spectrum of the sun#
See also
The solar spectrum will be further analyzed in the Application Examples Radiometric Analyis of Light Sources & Colorimetric Analysis of the Spectrum of the Sun.