4.3. Radiometric Analyis of Light Sources#
This section describes the practical application of Radiometry in the analysis of the emitted power and color fidelity of different light sources.
The investigated light sources are:
an incandescent lamp with known output power that serves as the calibration source.
a warm-white LED lamp (Toshiba LDA8L-G) with a nominal color temperature of 2700 K and an \(\rm{R_{\alpha}}\) of 80
a cool-white LED (Panasonic LDA4DGK4) with a nominal color temperature of 6500 K and an \(\rm{R_{\alpha}}\) of 84.
LED light sources were mounted in an integrating sphere. The spectrometer was calibrated using the procedure outlined in Section 2.1.6 using the incandescent calibration lamp, which is integrated into the integrating sphere. The spectrometer’s exposure time was adjusted before each light source change and after the calibration to avoid saturating the detector while maintaining a acceptable signal-to-noise ratio. The results are shown in Figure 4.7 (the result for the cool-white LED is shown without power calibration).
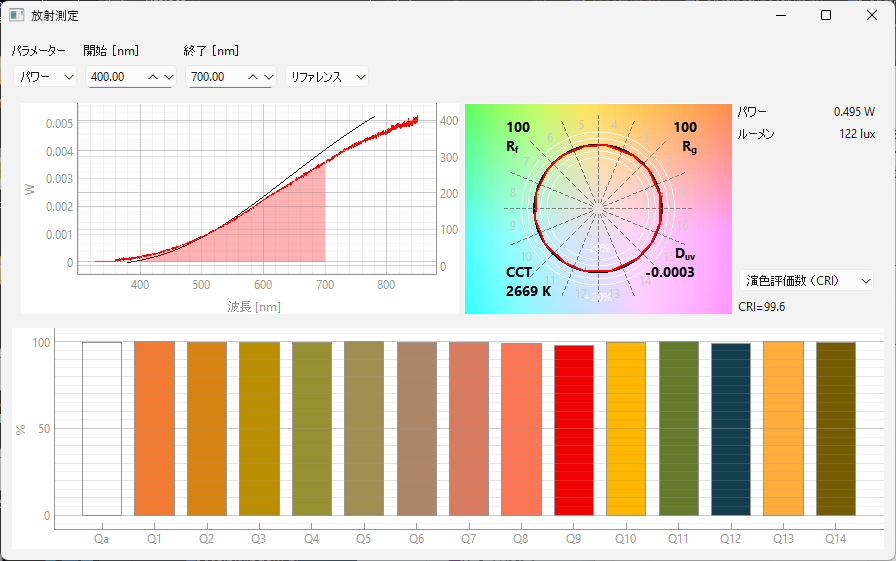
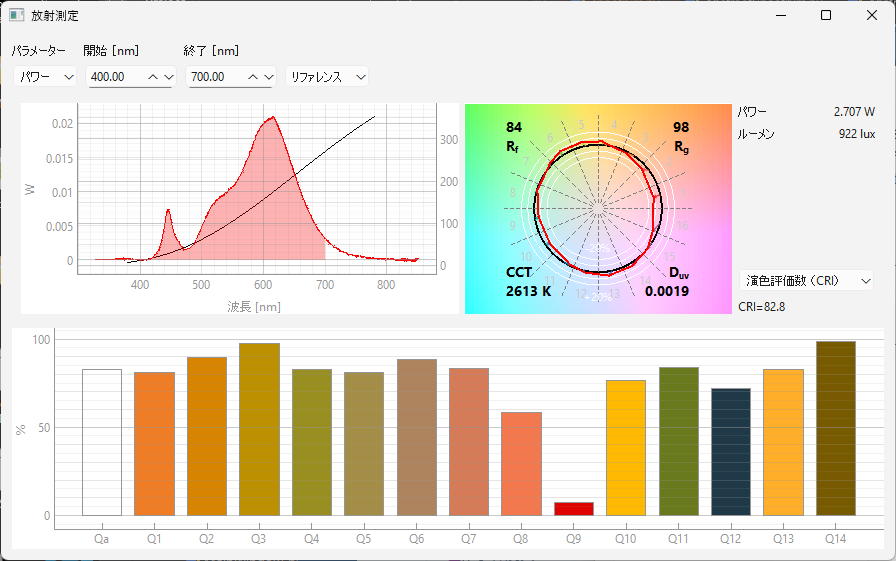
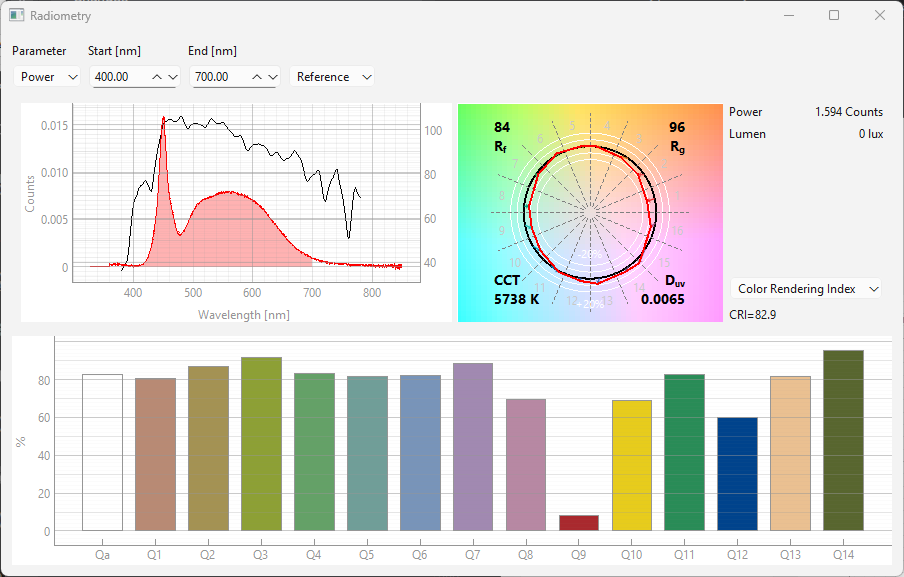
Fig. 4.7 Radiometric analysis of various light sources#
4.3.1. Results - Color Quality#
the perceived brightness of the warm-white LED (about 900 lm) slightly exceeds the nominal value. This value gradually decreases as the LED heats up. It is likely that the manufacturer’s specifications are minimum limits.
the incandescent lamp has a color rendering index (CRI) (\(\text{R}_a\)) close to 100, as expected from the definition of the CRI. The (calculated) reference curve closely matches the spectrum
the warm-white LED has a CRI (\(\text{R}_a\)) of 83, slightly exceeding specifications
the cool-white LED has a CRI (\(\text{R}_a\)) of 83, slightly below specification
the warm-white LED and the incandescent lamp have a similar color temperature and hence render the test color samples very similarly. The biggest exception is color #9 (deep red), which is poorly rendered by the LED
the cool-white LED shows a similar deficiency for color #9, but (as expected), the other colors are rendered more realistically due to its higher CCT. This is particularly apparent for color #13, which represents a typical skin tone.
the color temperature of the cool-white LED (5700 K) is quite a bit lower than the specification. It is not clear why this is the case, but it might be due to aging of the blue LED component.
the \(D_{uv}\) value for the incandescent lamp is close to 0. For the LEDs, the \(D_{uv}\) is slightly positive, indicating a subtle greenish tint characteristic of white-pumped LEDs
for the warm-white LED and the incandescent lamp, a (calculated) black-body emitter curve is used as reference, while for the cool-white LED, the CIE Daylight data is used
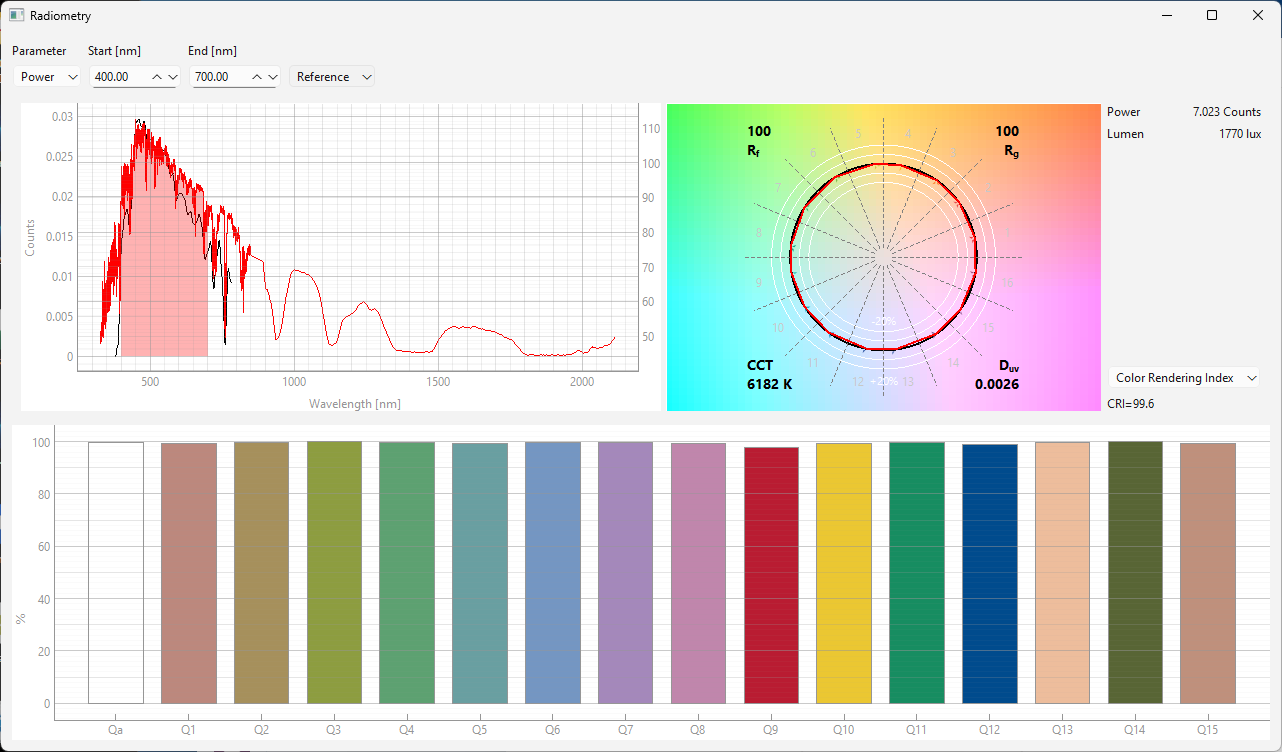
Fig. 4.8 Radiometric analysis of the spectrum of the sun#
We can compare this with the spectrum of the sun from Section 4.1, which is shown without power calibration (Figure 4.8). Being a black-body emitter, the spectrum of the sun also has a CRI of 100 and a color temperature > 6000 K. The dips in the CIE Daylight reference spectrum nicely coincide with the measured Fraunhofer lines (see also Figure 4.3). Comparing the sun with the cool-white LED, which has a similar color temperature, shows that sunlight renders all test colors with equally high fidelity, whereas the LED fails in particular at highly-saturated red (color #9). The \(D_{uv}\) is, maybe surprisingly, quite high and comparable to the \(D_{uv}\) of the warm-white LED in magnitude. This is likely a result of atmospheric scattering blue-shifting the solar spectrum.
4.3.2. Color Temperature & Planckian Loci#
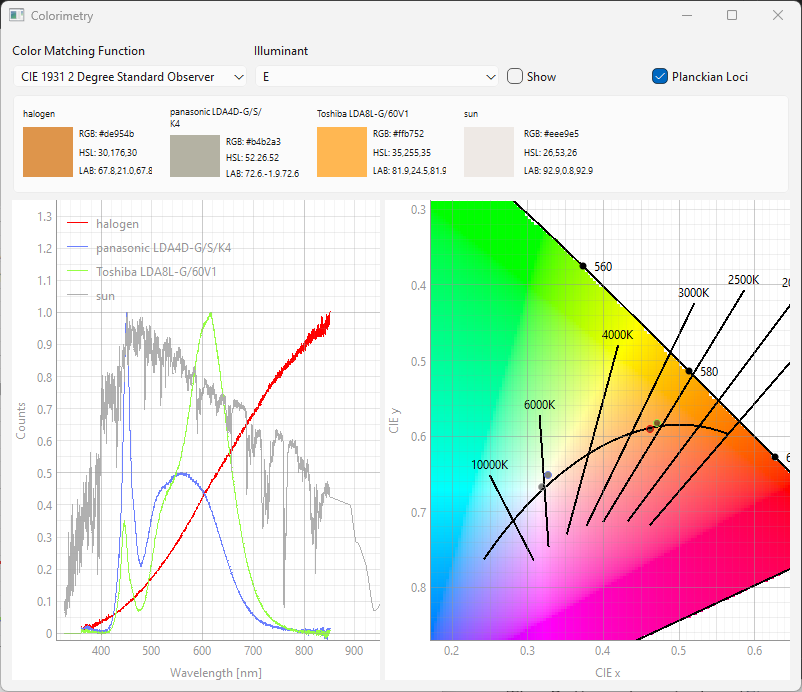
Fig. 4.9 Comparison of LED and incandescent light sources and their color temperature.#
Figure 4.9 shows a comparison of all four light sources (warm-white and cool-white LED, incandescent lamp, sun) in the colorimetry view. The positions of all four light sources (more or less) fall on the curve of Planckian Loci, which indicates that they all match the spectral characteristics of a black body emitter, albeit at different color temperatures. For the actual black body emitters (the sun and the incandescent lamp, red and grey outlined circles), the coincidence is noticeably better compared to the LEDs (blue and green outlined circles). The LEDs, being solid-state emitters, have discontinuous (peaked) spectral power distributions, which will always result in a measurable offset from the continuous Planckian Locus, even if their CCT is close. The differences in color temperature and quality of a neutral test target is illustrated by the calculated colors - sunlight clearly has the whitest, most neutral rendition whereas the lower color temperature sources cause a significant warmer tint.