4.2. Colorimetry of Light Sources & Color Charts#
This section provides practical tips and tricks as well as some application examples on colorimetric analysis. See Section 3.2 for background and a description of the parameters and user interface.
4.2.1. Colorimetric Analysis of the Spectrum of the Sun#
We can re-use the spectra obtained in Section 4.1 (The Solar Spectrum) for colorimetric analysis. Here, we are using the illuminant E, which is a flat curve (black trace in Figure 4.4), since spectra were obtained from an emissive source. Only the visible region of the spectrum is used for analysis and hence the majority of the spectrum, which falls into the mid-IR range, is ignored.
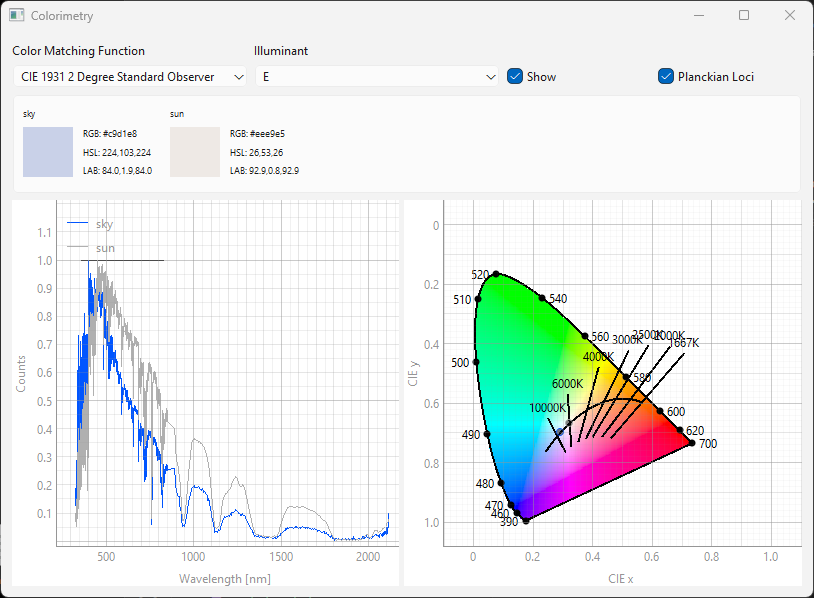
Fig. 4.4 Colorimetric Analysis - Spectrum of the Sun#
When the spectrometer input fiber pointed directly at the sun (gray trace in the left panel of Figure 4.4), the calculated color is a bright, slightly yellow-white, as expected. When light is collected indirectly by pointing the input fiber away from the sun, the color shifts to a cool, bluish-white (blue trace in the right panel of Figure 4.4), matching the expected blue color of the sky on a clear day. The position in the chromaticity diagram of both spectra coincides with the line of a black body emitter (Planckian Loci, black line in the right panel of Figure 4.4). This means both light sources (the sun itself and the scattered light from the sky) match the ideal color of a thermal radiator. The spectrum of the sun (circle with gray outline) corresponds to a color temperature of approximately 6000 K, which is a value typical for direct sunlight filtered by the atmosphere. On the other hand, the spectrum of the sky (circle with blue outline) suggests a color temperature of almost 10000 K. This indicates that there is a significant amount of atmospheric scattering (Rayleigh scattering \(I_{s, \rm{Rayleigh}} \propto 1/\lambda^4\)) caused by the relatively low position of the sun in the sky due to latitude and time of day. Since light at short wavelengths (blue light) is more effectively scattered by air molecules than red light, atmospheric scattering will blue-shift the spectrum. This matches the observations in Figure 4.3 that were obtained by comparing the raw spectra with the expected curve of a black body emitter with the temperature of the sun (5800 K).
4.2.2. Reflective Colorimetric Analysis#
In this section, spectra were obtained using a small, handheld spectrometer using light reflected from a printed color sample. The sample was illuminated by LED lamps (room lighting of an office environment) and spectra were recorded by placing the entrance pupil of the spectrometer close to the color sample at a shallow angle to the surface normal. The displayed spectra are the raw data from the spectrometer; no dark / background subtraction or intensity correction was performed.
Tip
For colorimetric analysis, the spectrum is analyzed in the range between 400-700 nm. If the sensitivity curve of the spectrometer is not reasonably flat in this spectral range, performing a intensity calibration is recommended for best results.
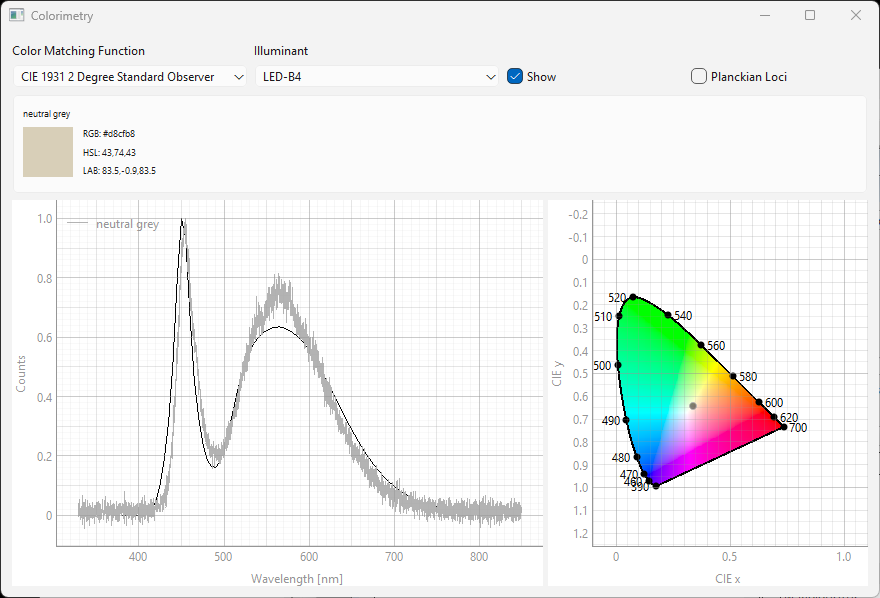
Fig. 4.5 Colorimetric Analysis - Illuminant#
Figure 4.5 shows the spectrum reflected of an office desk with a bright white color. The black line represents the LED-B4 illuminant, a bright white LED light source with a color temperature of 5100 K, which is typical for office settings. The two spectra roughly match, indicating that this illuminant is a good choice to represent the light source used in this experiment. The calculated color is a slightly yellowish gray, which reasonably matches the visual perception of the desk’s color.
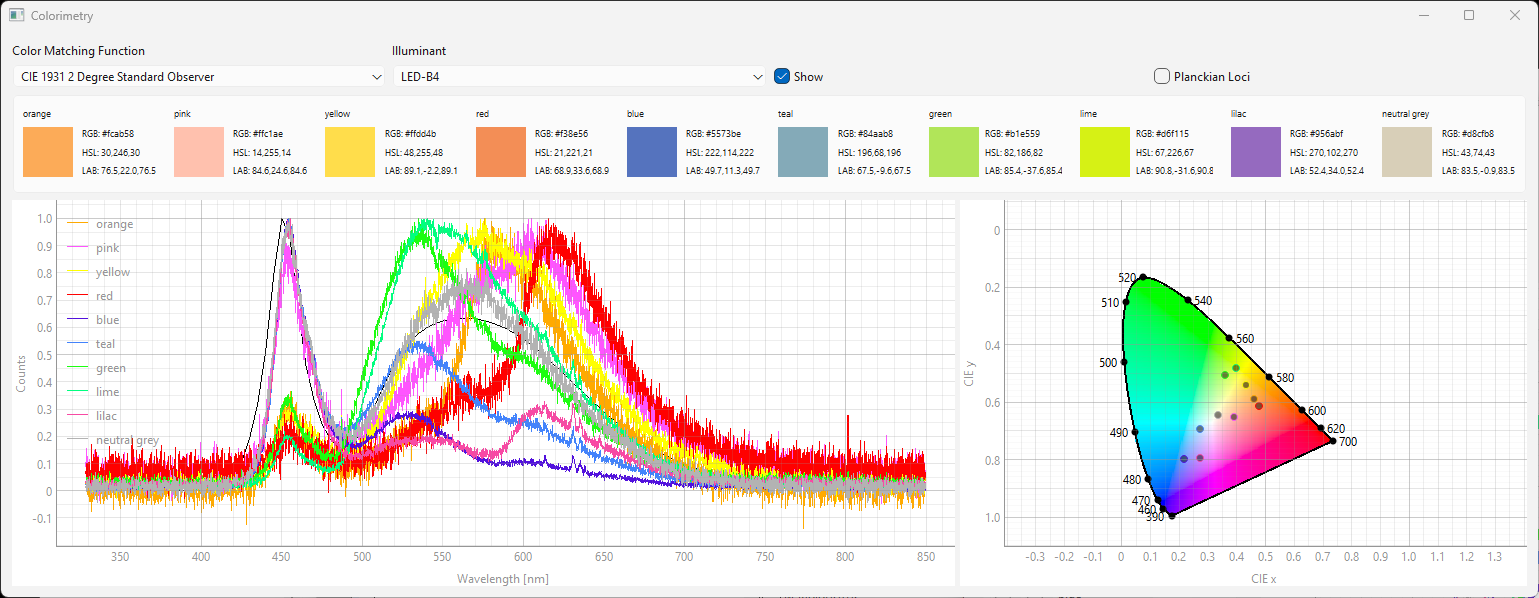
Fig. 4.6 Colorimetric Analysis#
Figure 4.6 displays spectra obtained from different color samples (with the names taken from the color sample’s description) in the left pane. All spectra have been normalized, which is automatically done prior to analysis. Significant spectral differences even for perceptually ‘close’ colors (e.g. green and lime) can be observed. Using the correct illuminant, the calculated color and visually perceived color match quite well over a wide range of different colors. Color fidelity could be further improved by:
standardized illumination
more repeatable spectrum collection, i.e. avoiding specular reflections and shadowing, and maintaining a constant reflection angle.
intensity calibration, though the effect will likely be very minor
an improved signal-to-noise ratio for some of the spectra