
2.3. Using Multiple Spectrometers#
TII Spectrometry supports the simultaneous control of multiple supported spectrometers . This can be useful in the following scenarios:
to combine spectrometers monitoring a single source with adjacent spectral ranges to expand spectral coverage. This used in the application example ‘The Solar Spectrum’
to use multiple spectrometers (with identical or different spectral coverage) to monitor several processes simultaneously
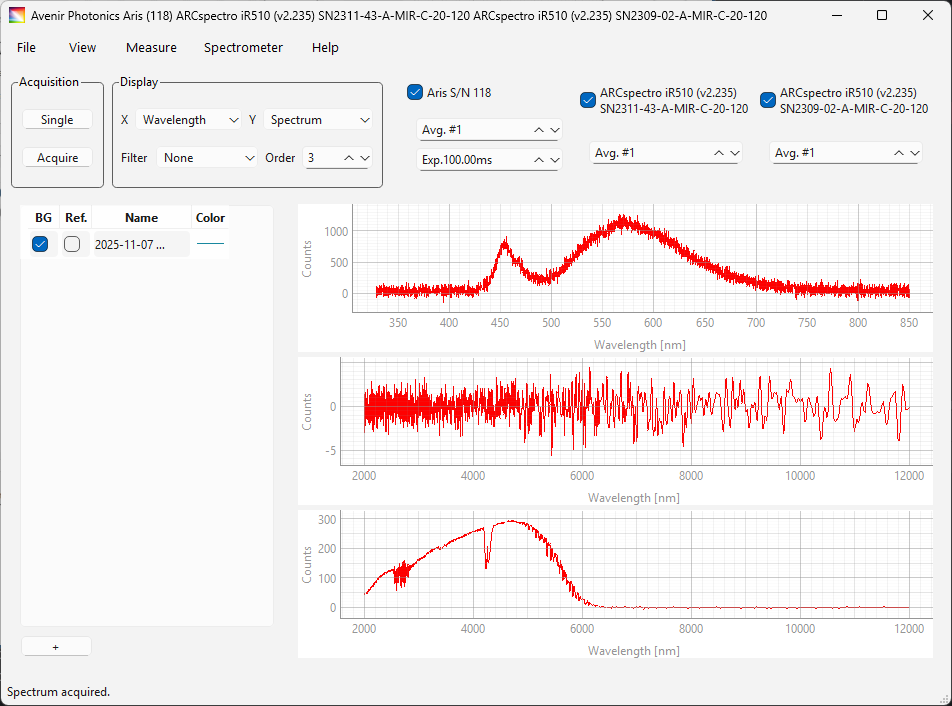
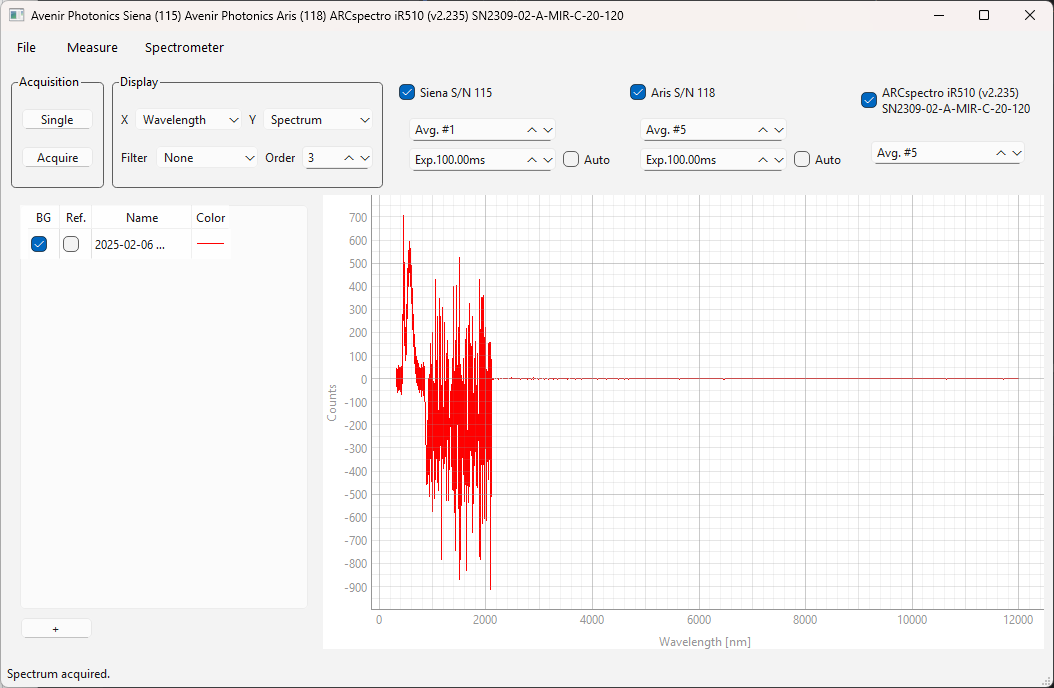
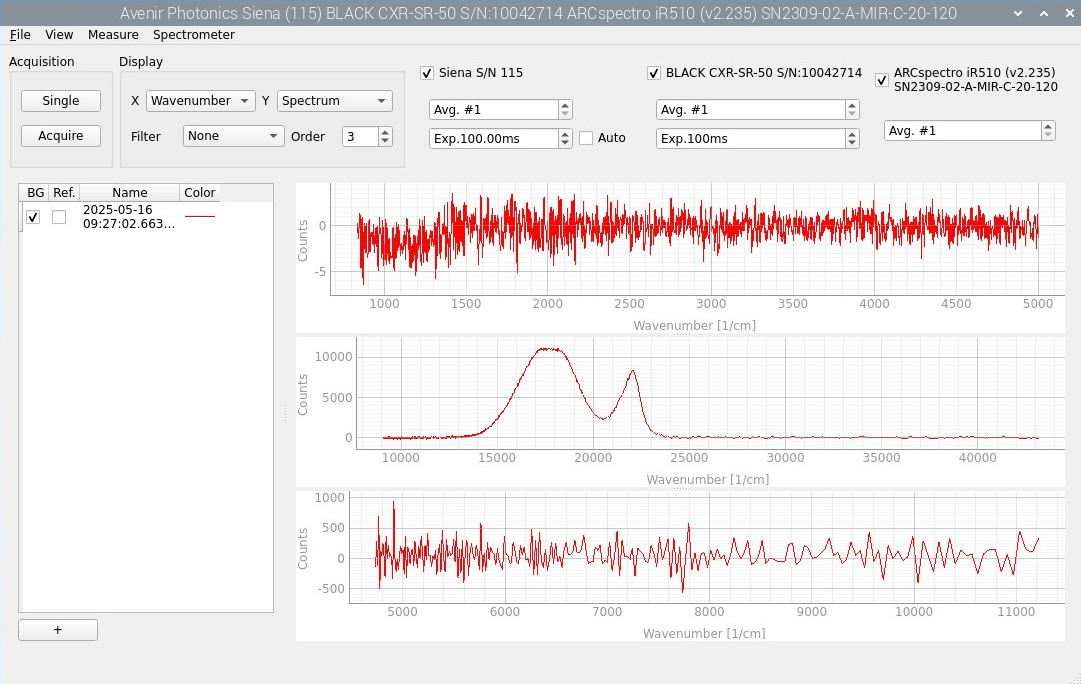
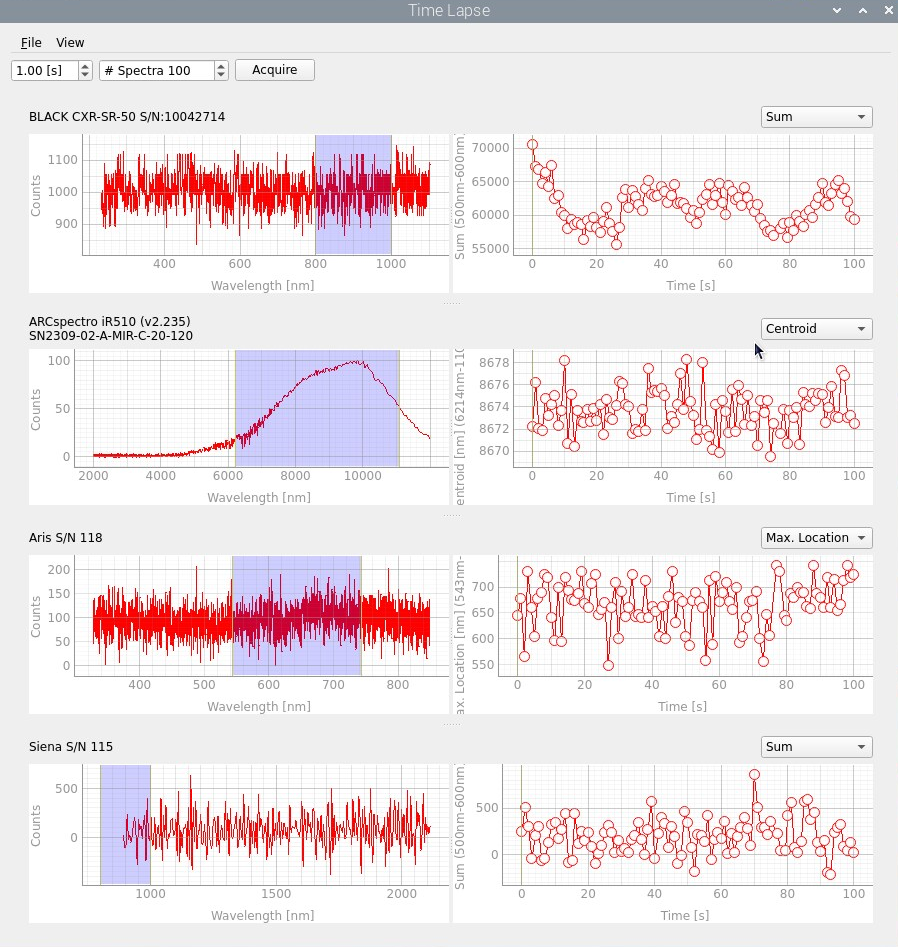
Fig. 2.20 Using multiple spectrometers in TII Spectrometry#
Examples for these applications are displayed in Figure 2.20. There are no limitations on the number or type of spectrometers that can be controlled simultaneously in TII Spectrometry.
See also
See Table 1.1 for supported devices on different platforms and Section 2.2 for caveats applying to individual device classes.
2.3.1. Device Manager#
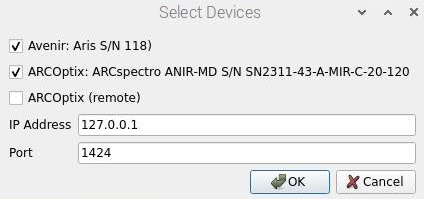
Fig. 2.21 The Device Manager#
To connect to multiple spectrometers, use the Device Manager (Figure 2.21), which can be accessed using . The Device Manager window will display all supported and connected devices. TII Spectrometry supports both local (directly connected to the host computer) and remote (directed to a different computer that also runs TII Spectrometry) spectrometers. Local spectrometers are displayed in the left column of the Device Manager. To connect to a remote host running TII Spectrometry
make sure that the TCP/IP remote control server is running on the remote machine.
make sure the TII Spectrometry radio button is selected
enter the IP address and port displayed in the device manager window.
(optional) click the Check button - this will try to connect to the remoe host. If the connection was successful, the name of the remote spectrometer will be displayed
select the Use checkbox to add this spectrometer
Note
To connect to multiple remote hosts, click the + button at the botton left to add an additional remote connection dialogue.
To connect:
enable the checkbox for the devices you would like to connect to
click OK
Hint
Local and remote devices can be mixed freely.
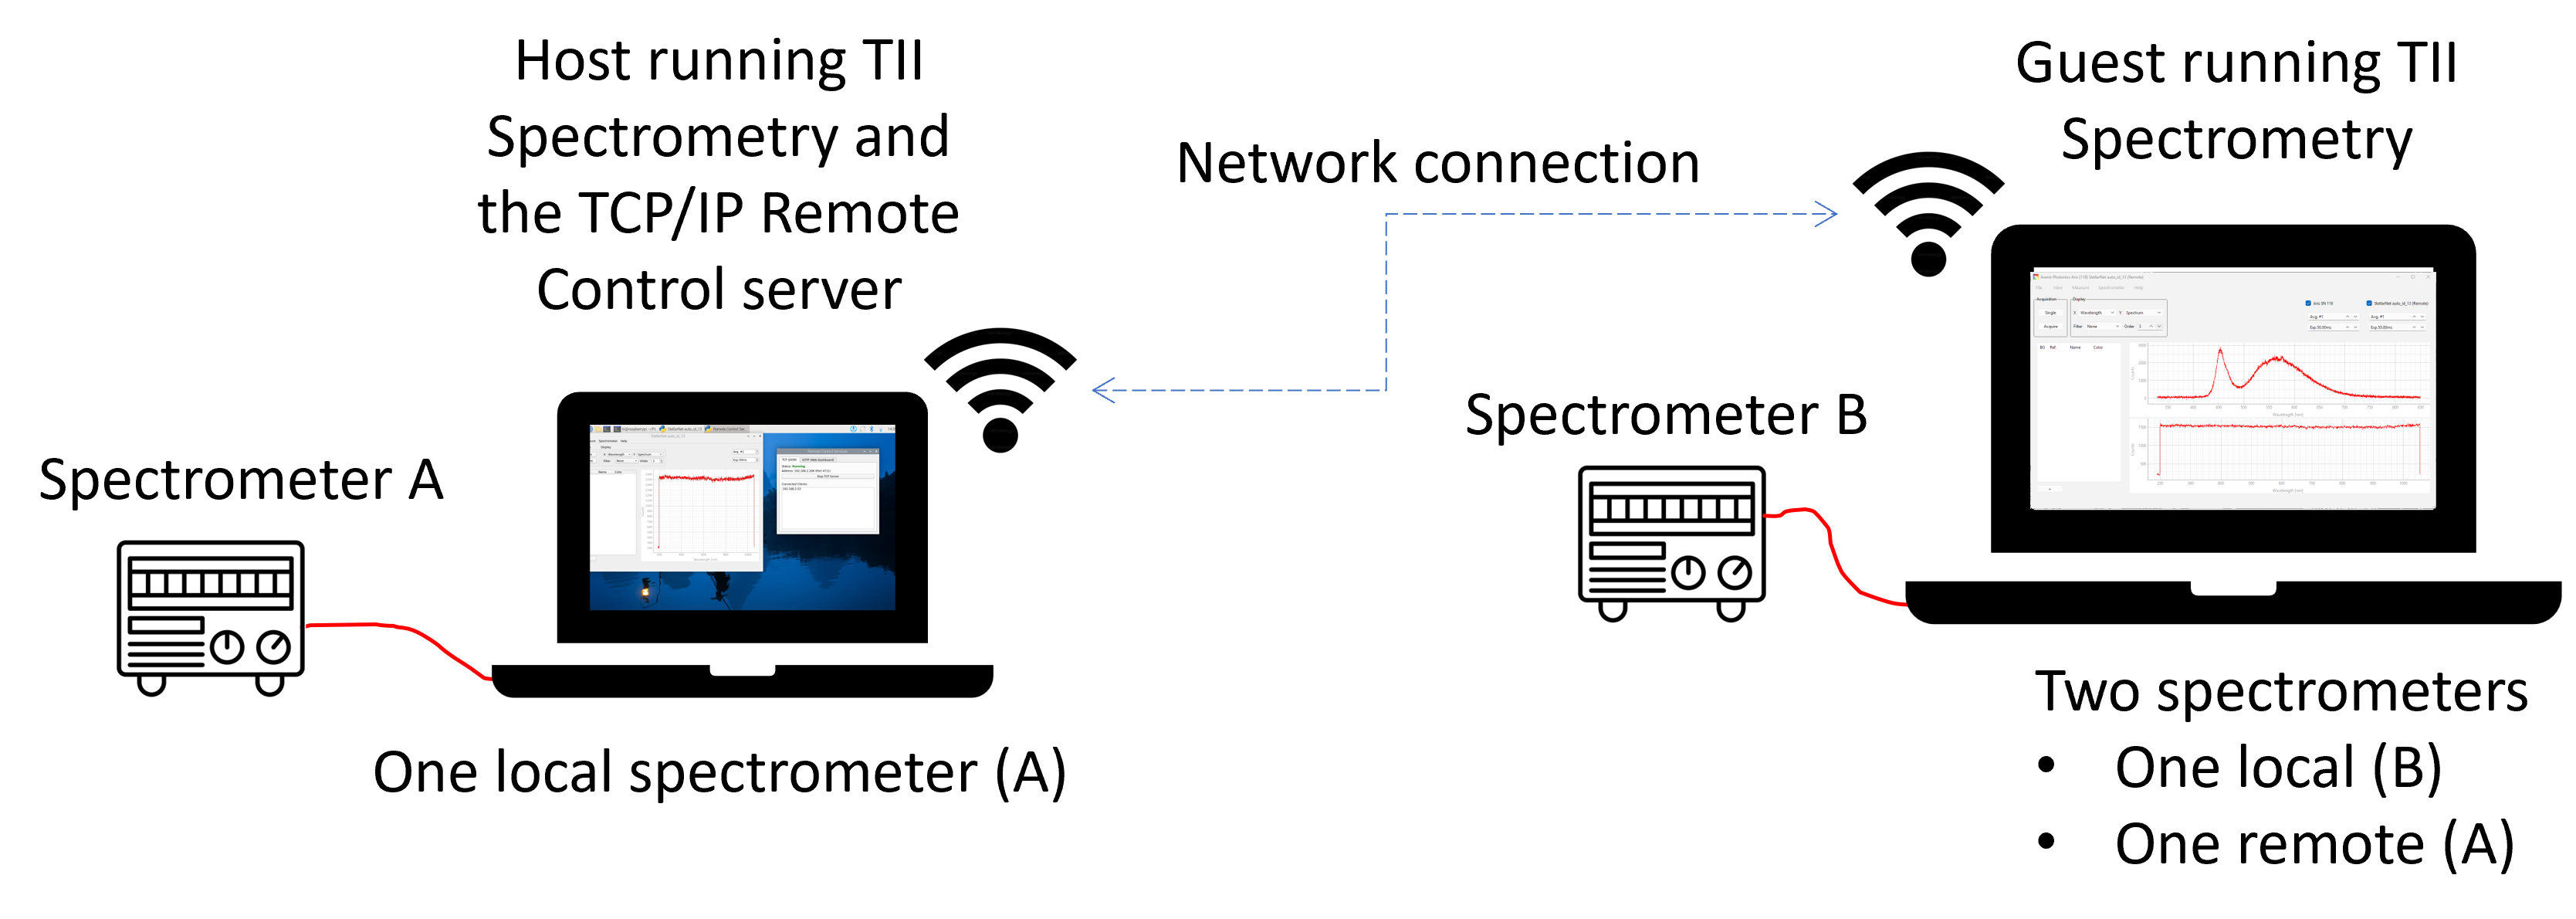
Fig. 2.22 Remote Control over WiFI#
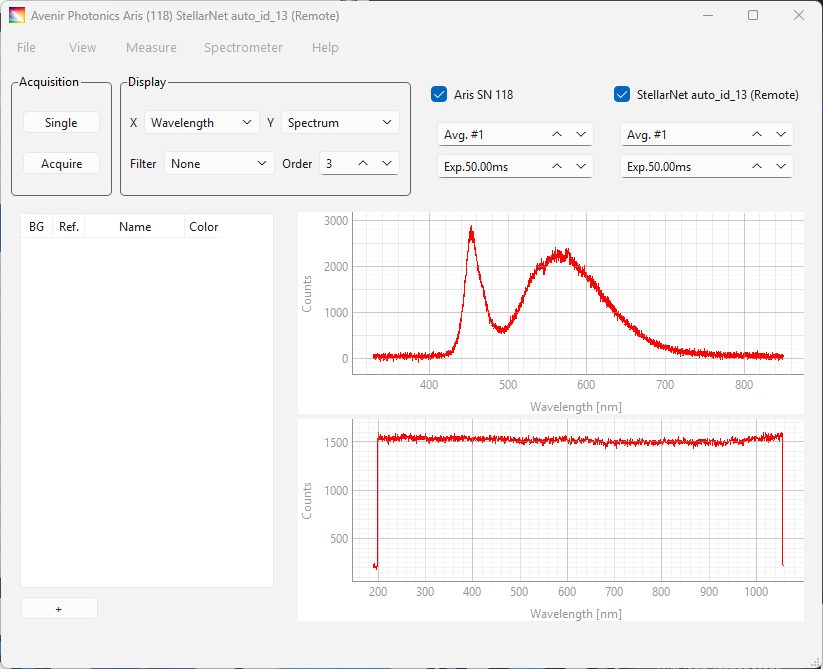
Fig. 2.23 Control of one local and one remote spectrometer using TII Spectrometry as server (host) and client (guest).#
See also
See Section 2.2.2.1 for details on remote connections to ARCoptix devices.
2.3.2. Use & Display Options#
Connected devices will be displayed on the top bar of the main window. Here:
you can set the exposure time and averaging number for each device device individually
use the checkbox to activate or (temporarily) deactivate one or more devices.
Two display options are available:
the Combined view. Here, spectra from different devices are combined and displayed on the same spectral axis. This is useful when using multiple spectrometers to expand spectral coverage.
the Split view. Spectra are displayed in separated graphs.
See also
Figure 2.20 shows examples for these two display modes.
The menu gives access to Time-lapse Recordings, which allows software-synchronized time-lapse acquisitions using multiple spectrometers. In the Time-Lapse window, you can switch between Combined and Split display using the menu.
The menu gives access to spectrometer settings for each connected device, e.g Intensity Calibration
the spectrometer menu now contains the command. This allows adjusting the wavelength range covered by each spectrometer by setting a switchover wavelength, i.e. the wavelength at which switching from one to the next spectrometer occurs (see Figure 2.24 for an example)
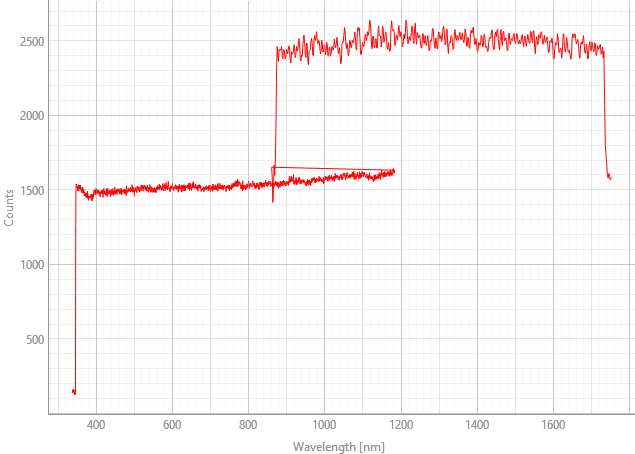
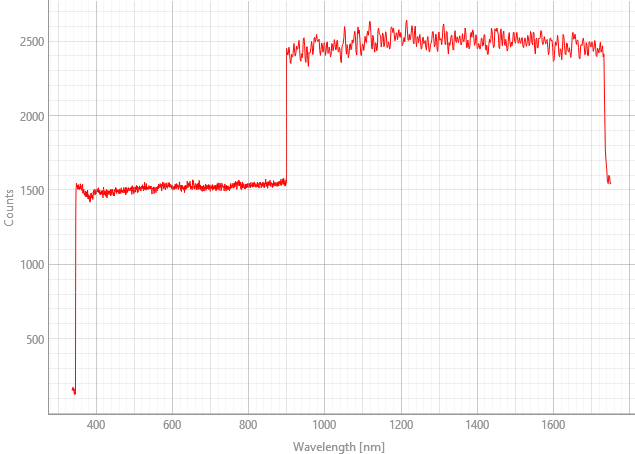
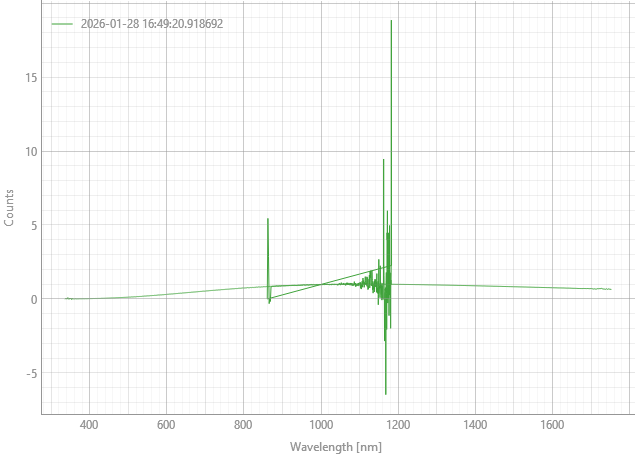
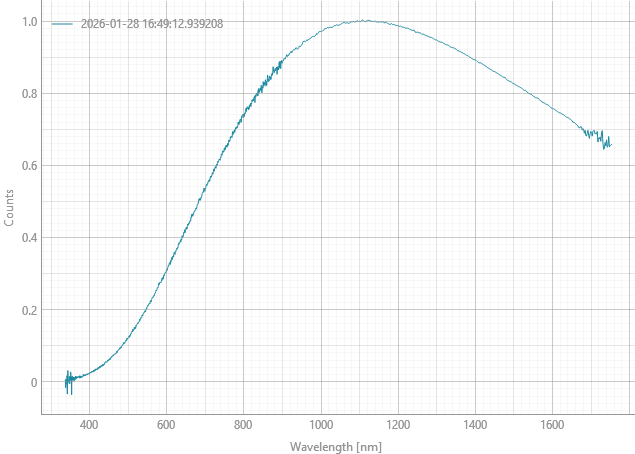
Fig. 2.24 Stitching (left) vs no stitching (right)#
recordings using multiple spectrometers can be processed, saved, and loaded from disk just like regular, single-device spectra.
multi-spectrometer configurations can be saved and reloaded.