
4.4. Plastic Identification#
4.4.1. Mid-Infrared Spectroscopy#
Mid-Infrared (Mid-IR) spectroscopy, operating in the 4000 cm-1 to 400 cm-1 wavenumber range, is the gold standard for identifying and classifying different types of plastics. When mid-IR light hits a plastic sample, the chemical bonds within the polymer chains (like C-H, C=O, and C-C bonds) absorb energy at specific, characteristic frequencies. This absorbed energy causes the bonds to vibrate (stretch, bend, rock, etc.). Since every type of plastic (e.g., Polyethylene, Polypropylene, PET) has a unique combination and arrangement of these chemical bonds, it produces a distinct pattern of absorption peaks. This pattern is called the infrared absorption spectrum or molecular fingerprint.
The measurement setup for plastic identification is shown in Figure 4.10 (left panel).
A mid-IR light source (top) illuminates the sample. Transmitted IR light is directly collected by an FTIR spectrometer.
Absorbance spectra are collected in the transmission geometry, meaning that thin plastic films are placed directly in the beam.
Absorbance was calculated using the procedure outlined in Section 2.1.4.1.
single FTIR scans without averaging were acquired, resulting in a cycle time of around 200 ms.
three household plastic samples were used: polystyrene (PS), polyethylene (PE), and polypropylene (PP)
the resulting SVM Classification model is displayed in Figure 4.10 (right panel).
the spectral region of interest was cropped to the fingerprint region between 800 cm-1 and 2000 cm-1.
Note
Cropping was primarily done to remove the highly absorbing C-H stretch region around 2900 cm-1, where very little light reaches the detector. This results in very high and fluctuating absorbance, which is detrimental to proper data scaling. It is important to note that the fingerprint region contains the relevant information for differentiating the plastic samples. In contrast, the high-energy C-H stretch region is common to all organic polymers and hence of little use for classification.
the data was scaled using SNV scaling - the data shown in Figure 4.10 reflects this
the confusion matrix in Figure 4.10 indicates that a classifier that can distinguish the three different types of plastic has been trained successfully.
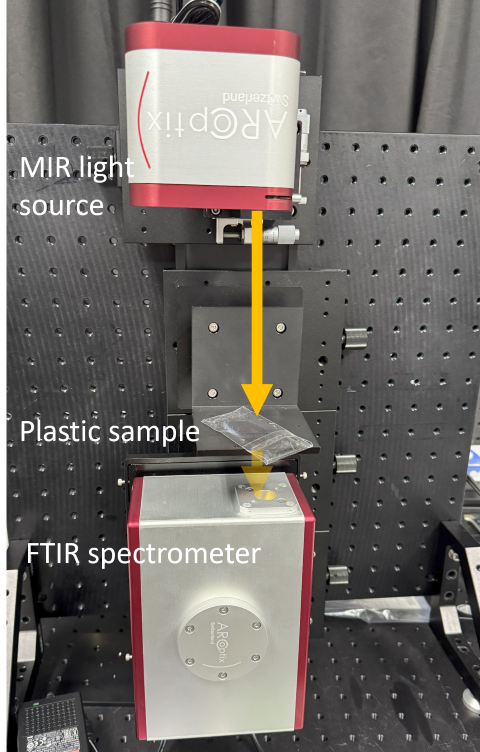
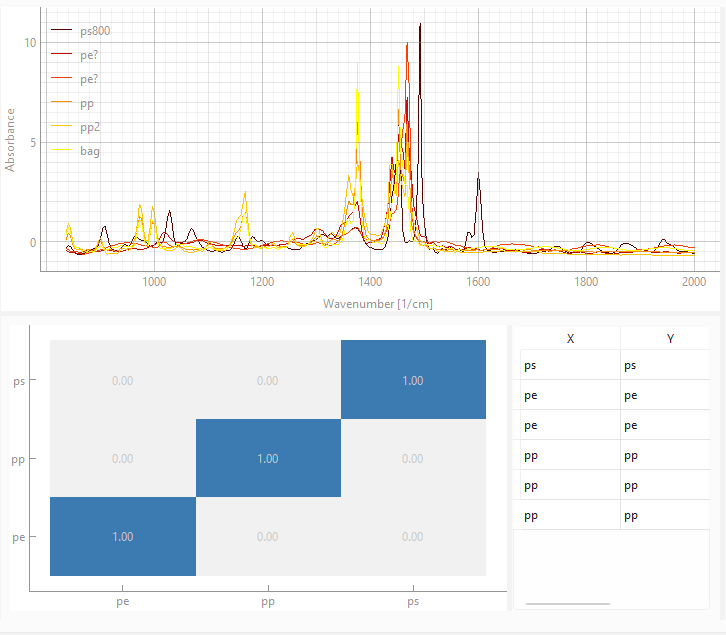
Fig. 4.10 Plastic Classification by Mid-IR Spectroscopy#
Figure 4.11 displays snapshots of real-time plastic identification using the Monitoring view of TII Spectrometry. Here, plastic samples were inserted into the mid-IR light beam while continuously acquiring spectra. The samples were different from the training samples but of known composition in order to verify classifier accuracy.
accuracy was generally excellent provided sufficient light could pass through the sample - the transmission setup will fail for thick samples
SNV scaling does a good job of standardizing the overall intensity and removing baseline curvature. Hence, the SVM model is forced to focus exclusively on the shape and position of the characteristic peaks—the true chemical information. This results in a model that can - within reason - classify samples of different thickness (and hence difference absorbance) using transmission mid-IR spectroscopy.
spectral differences between the three types of plastic are very obvious in the mid-IR - it is hence no surprise that the classifier performs well
no blank spectra were included during training. This is the reason for the misclassification of the blank spectrum in Figure 4.11 as PE
the model could easily be extended to incorporate more sample classes
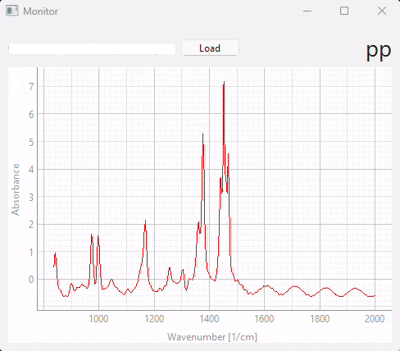
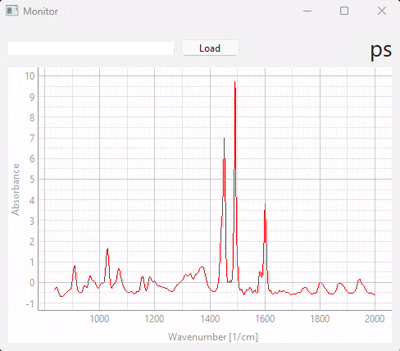
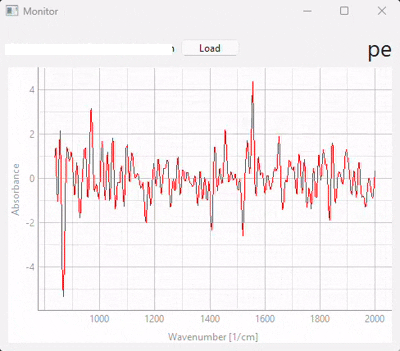
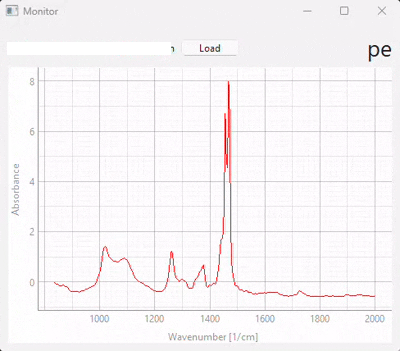
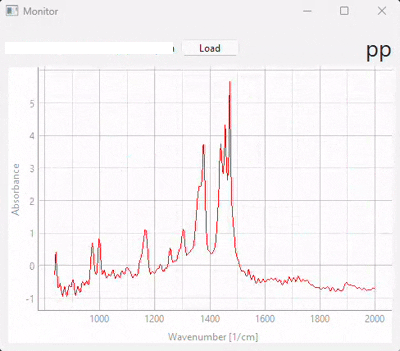
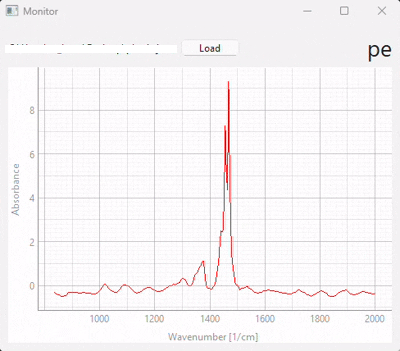
Fig. 4.11 Snapshots of real-time plastic classification using MIR spectroscopy#
4.4.2. Near-Infrared Spectroscopy#
Near-Infrared (NIR) spectroscopy between 800 nm to 2500 nm (12500 cm-1 to 4000 cm-1) is widely used for rapid, non-destructive, and high-throughput plastic identification, particularly in recycling and sorting facilities. Unlike Mid-IR, which excites the fundamental vibrations of bonds, NIR light excites overtones (multiples of the fundamental frequency) and combination bands (sums or differences of two or more fundamental frequencies). For plastic samples, the overtone of the C-H stretching region is the dominant signal (Figure 4.12). The resulting NIR spectra are often broad and heavily overlapping, making direct visual interpretation difficult. This makes near-IR spectroscopy an ideal showcase for machine-learning based polymer identification.
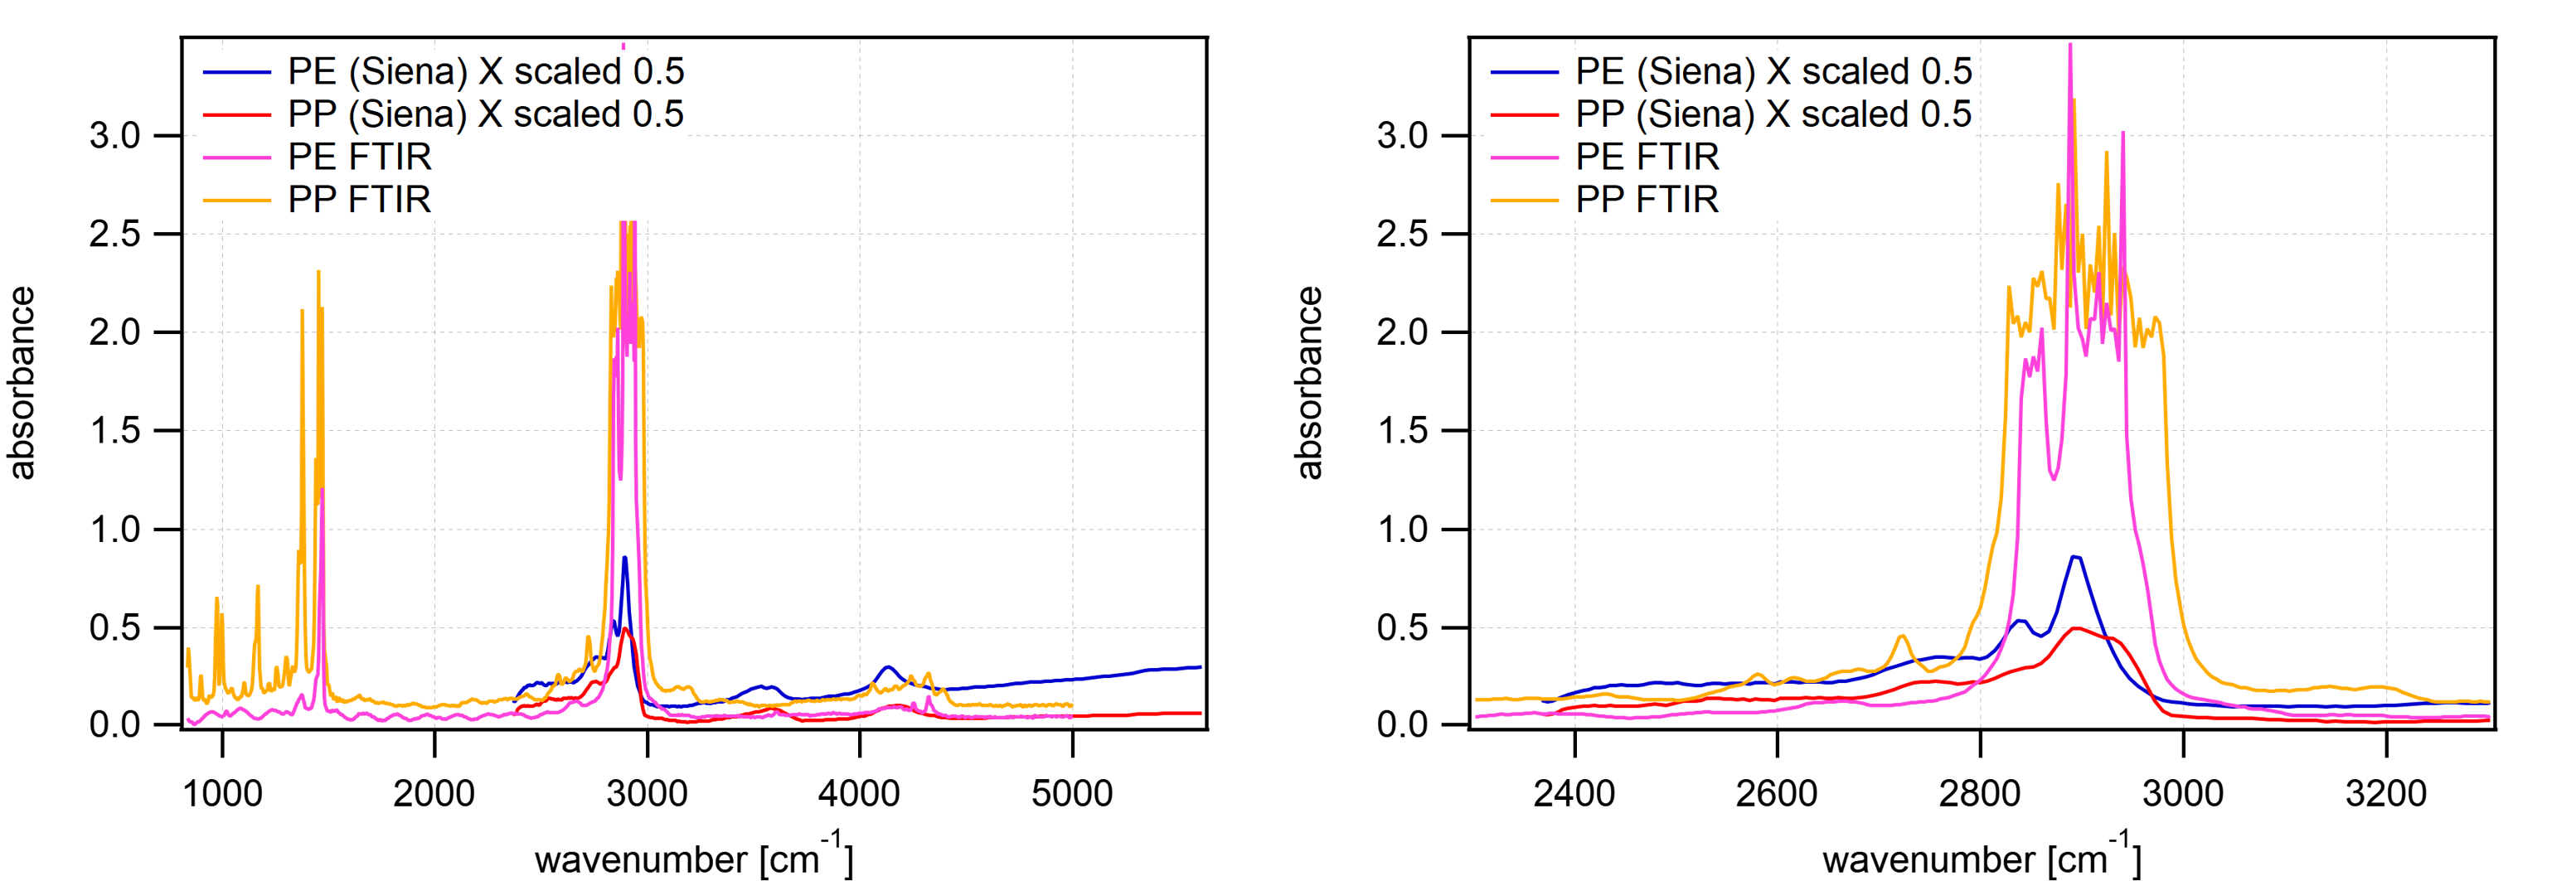
Fig. 4.12 Comparison of near-IR (blue and red) and mid-IR (pink and orange) spectra of plastic samples. The near-IR spectra have been scaled by a factor of 1/2 along the x-axis.#
The measurement setup is shown in Figure 4.13 (left). Analogous to the mid-IR experiment, absorbance spectra were collected in transmission geometry and the transmitted near-IR light was introduced into the spectrometer using a fiber. The exposure time was around 1 ms, sufficient for high-quality spectra due to the high absorbance of C-H bonds even at the second harmonic (first overtone). For training the SVM classifier (Figure 4.13 right),
spectra were cropped between 1000 nm and 2000 nm
SNV scaling was applied
a blank spectrum (no sample in the beam path) was included in the training set, which consists of only four spectra (PS, PP, PE, blank) in total.
Note
This is a (deliberately) minimal training set to demontrate the robustness and performance of the SVM classifier. For a real-world model, more spectra would be included.
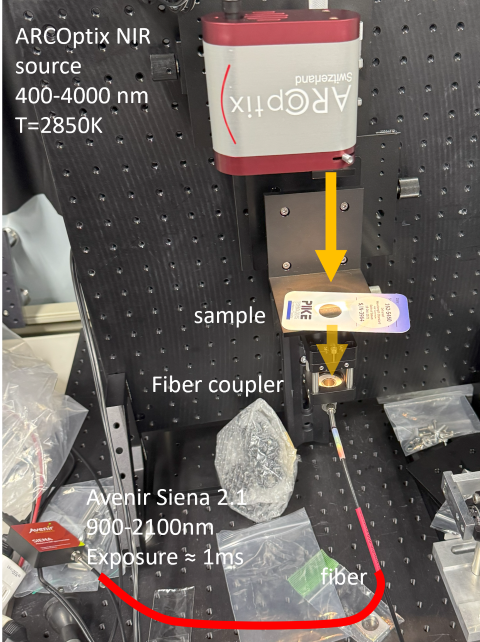
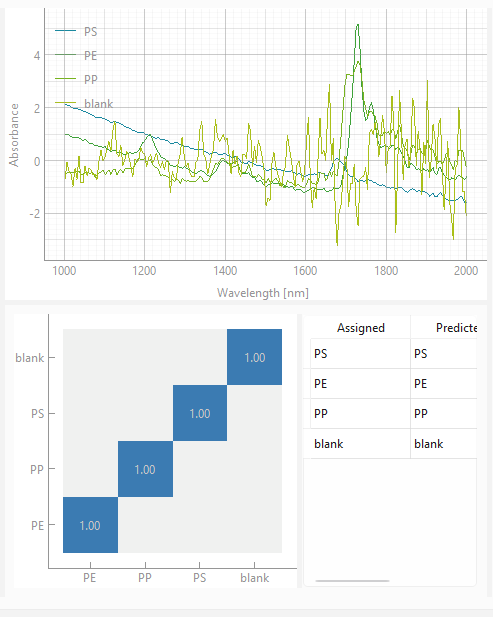
Fig. 4.13 Plastic Classification by Near-IR Spectroscopy#
Figure 4.14 displays snapshots of real-time classification of different plastic samples using the trained model. While performance is excellent,
some samples (especially PS) suffer from high nonspecific absorbance / scattering in the near-IR range, resulting in a strong non-linear baseline. This baseline can mislead the classifier and interfere with scaling.
the transmission geometry is very limiting since thicker or colored samples will not transmit enough near-IR light for successful classification
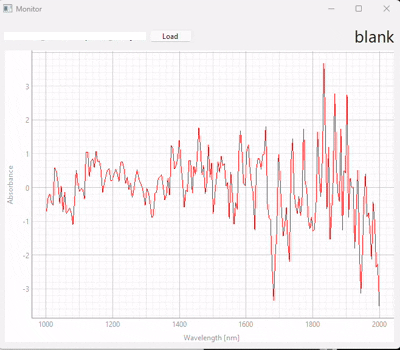
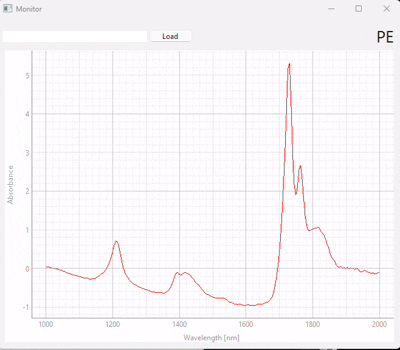
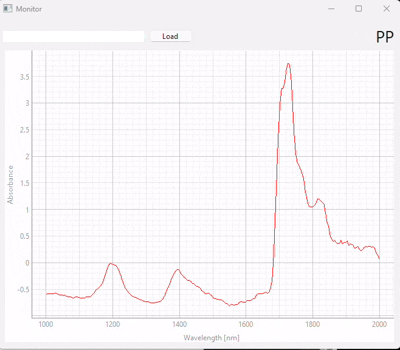
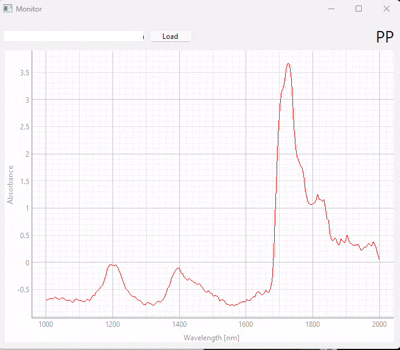
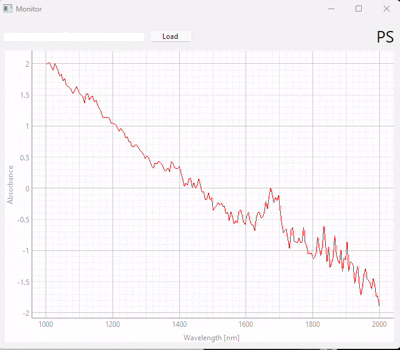
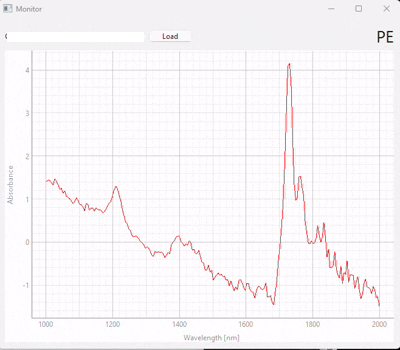
Fig. 4.14 Snapshots of real-time plastic classification using near-IR spectroscopy#
Using the baseline subtraction preprocessing step can remove the non-linear baseline - the result is displayed in Figure 4.15. This accentuates the absorption peaks and enables classification even in the presence of non-specific absorbance or strong scattering.
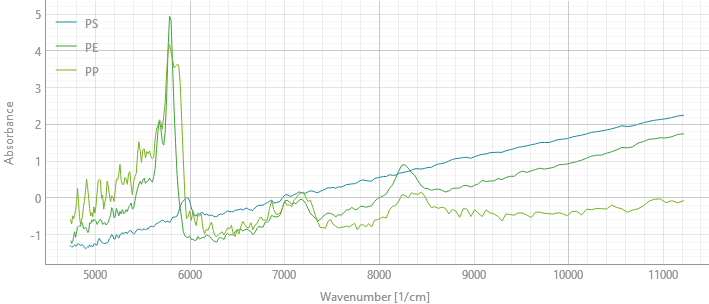
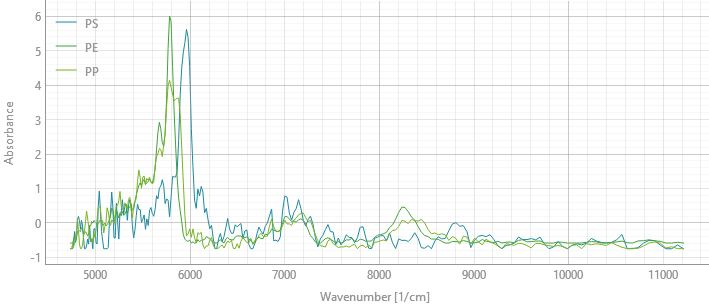
Fig. 4.15 NIR Classification - Baseline Subtraction#
To benchmark the classifier under more realistic conditions,
the classifier was trained using spectra collected in transmission after baseline subtraction (the same four spectra used in Figure 4.13)
the classifier was evaluated using near-IR reflections from the plastic sample surface using a VIS-NIR fiber probe (Figure 4.16 left).
The result is displayed in Figure 4.16 (right)[1]. Baseline subtraction permits the SVM classifier to solely focus on the chemical information contained in the absorption peaks, resulting in a model with general applicability for plastic identification, independent of the collection geometry. Despite being trained on only four spectra, overfitting was avoided, as demonstrated by validating the classifier using spectra that were not only obtained from samples different from the training set but also recorded under drastically different experimental conditions.
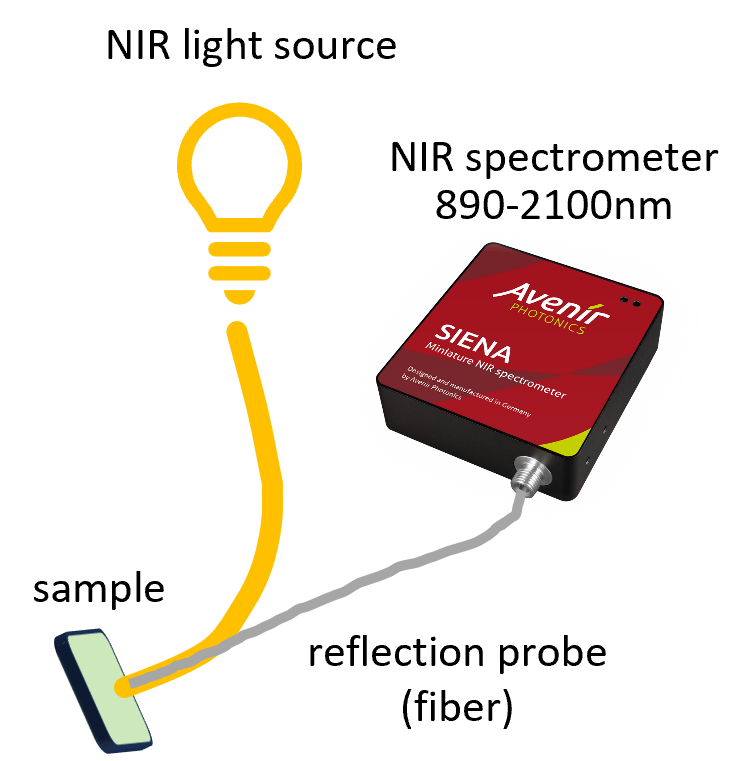
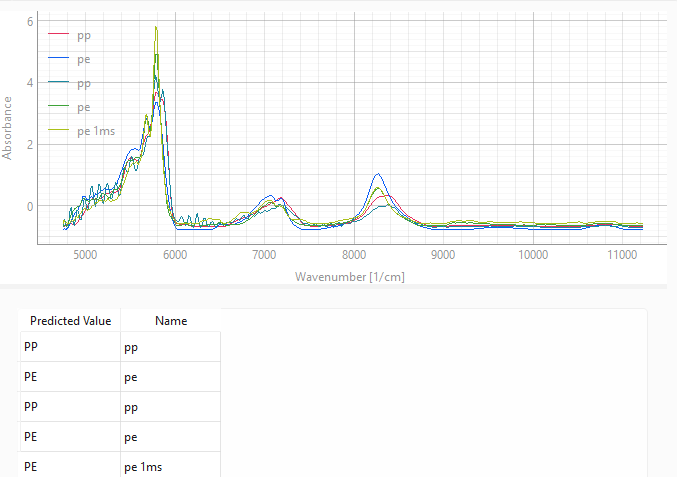
Fig. 4.16 NIR Classification (Reflection Geometry)#