

5.2. Interface#
TII Spectrometry Touch’s interface is built for a touchscreen: a full-screen spectrum display with two side drawers, opened with Settings (left) and Data (right) in the top bar, and nothing else to navigate.
5.2.1. Connecting a Spectrometer#
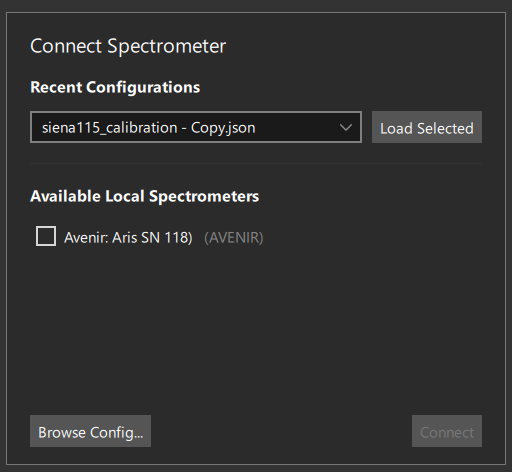
Fig. 5.4 The Connection Dialogue#
The Connection Dialogue (Figure 5.4) is shown on startup. It lists the spectrometers currently attached to the device under Available Local Spectrometers - select one and press Connect.
Instead of connecting to a bare spectrometer, a previously saved configuration can be loaded, which also restores acquisition settings, spectra and a background:
Recent Configurations lists the most recently used configuration files; select one and press Load Selected.
Browse Config… opens the configurations folder to pick any saved or factory configuration.
Note
TII Spectrometry Touch can also be started directly with a configuration already selected, bypassing
this dialogue, using the --config and --autoload command line options - see
Configuration File Format.
5.2.2. Measurements#
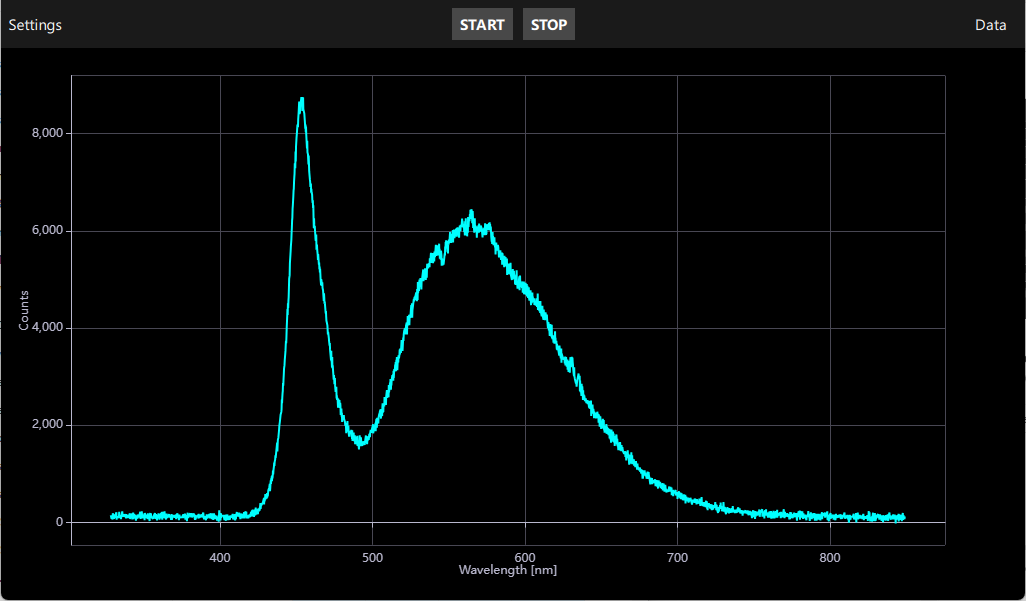
Fig. 5.5 The TII Spectrometry Touch Main Screen#
Once connected, the main screen (Figure 5.5) shows the live spectrum full-screen. START begins continuous acquisition, STOP pauses it.
The plot responds to standard touch gestures:
pinch to zoom in or out
pan (drag with one finger) to move the visible range
double-tap on the plot to reset the zoom to fit the current data automatically
Tip
Pinch-to-zoom scales bothe axes equally. To restrict zooming to a single axis, use the Lock X and Lock Y controls.
5.2.3. Acquisition Settings#
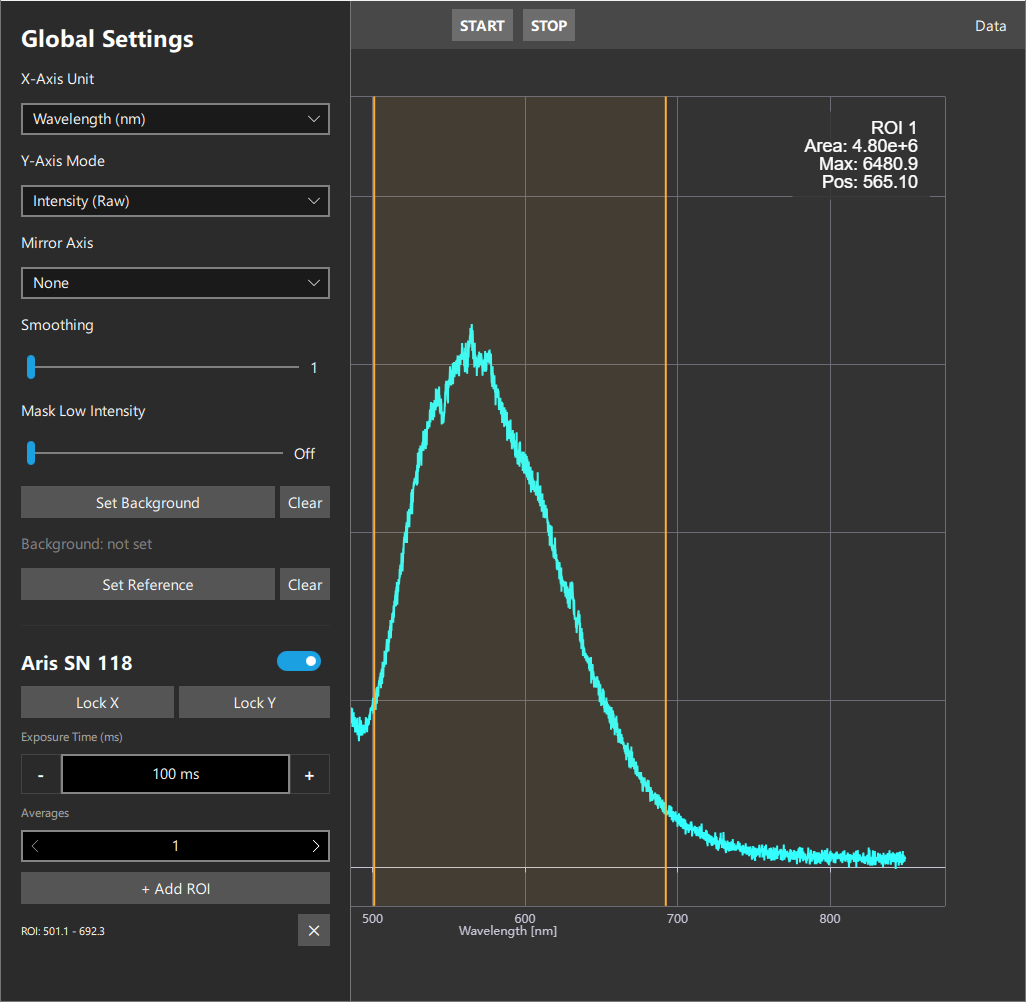
Fig. 5.6 The TII Spectrometry Touch Acquisition Settings#
The Settings drawer (Figure 5.6) collects the global display options and, below them, one section per connected spectrometer:
- X-Axis Unit / Y-Axis Mode / Mirror Axis
Select the spectral domain (wavelength or wavenumber) and how the spectrum is displayed (intensity, absorbance or transmittance), and, optionally, a second (“mirror”) trace showing raw or reference-free data on its own axis.
Hint
Displaying raw data is useful to avoid saturating the spectrometer.
- Smoothing
Applies a moving-average filter of the selected width.
- Mask Low Intensity
Replaces points below the set fraction of the reference intensity with a gap, to avoid noisy regions of an absorbance or transmittance spectrum dominating the plot.
Offdisables it. See Figure 5.7 for an example.- Set Background / Set Reference
Record the currently displayed spectrum as the background or reference for subtraction and absorbance/transmittance calculations, respectively; Clear removes it. The label below each pair shows whether one is currently set. Both are included when saving a configuration.
Below the global settings, each connected spectrometer has its own section with a name and an on/off switch, Lock X / Lock Y (keep that device’s axis range fixed while others autoscale), exposure time, number of averages, and + Add ROI to add a region of interest to the plot - shown with its area, maximum and peak position, and removed with the ✕ button next to it.
5.2.4. Saving Data#
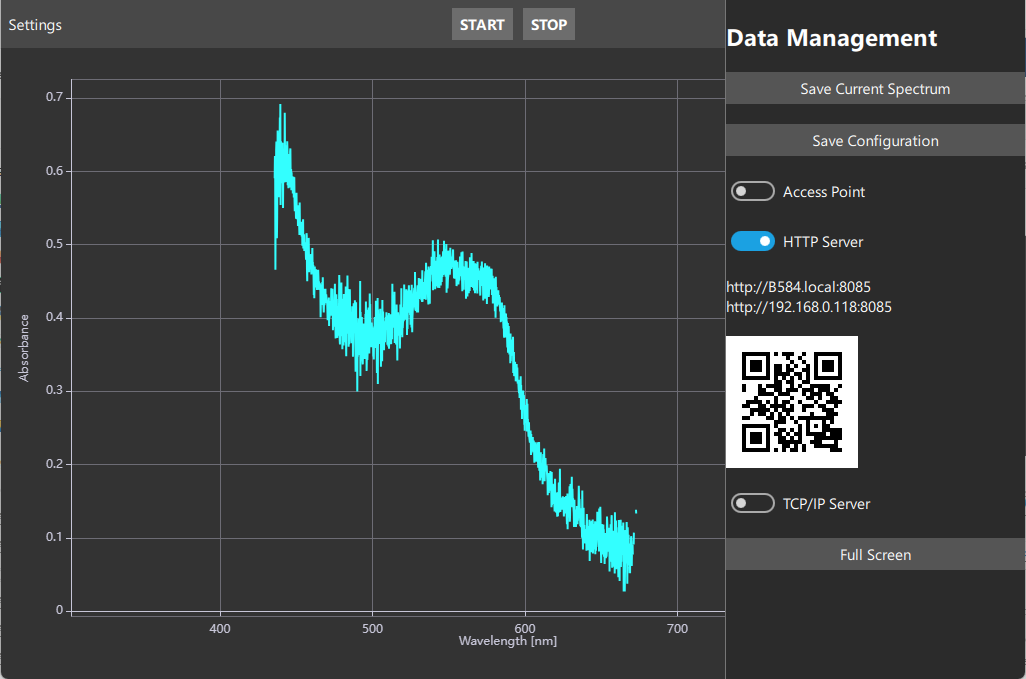
Fig. 5.7 The TII Spectrometry Touch Data Sidebar#
The Data drawer (Figure 5.7) collects everything related to saving and sharing data, and the network toggles - see Network & Sharing for the Access Point, HTTP Server and TCP/IP Server switches.
Save Current Spectrum saves the spectrum currently on screen to the shared folder, where it can be picked up over the network. Save Configuration saves the acquisition settings, spectra and background currently in use, together with the state of the network switches, as a reusable configuration - see Saving a Configuration.